How χGRIDs extend the UN's 2025 settlement methodology to neighborhood-scale geographies.
Harry Brisson · Data Lead & Co-Founder, Ward Wise · Mic Check
miccheck.media/what-is-chicago
github.com/HarryBrisson/chiGRIDs
Five questions
What we will answer in thirty minutes
1Who draws the lines?
2What do the lines cost us?
3Is there a rule instead?
4What does the rule say about Chicago, Peoria and the rest of Illinois?
5Can a rule work at neighborhood scale?
Chicago first, then Peoria and Illinois. The last slide answers all five in one line each.
Why I care
I measure wellbeing in cities, everywhere
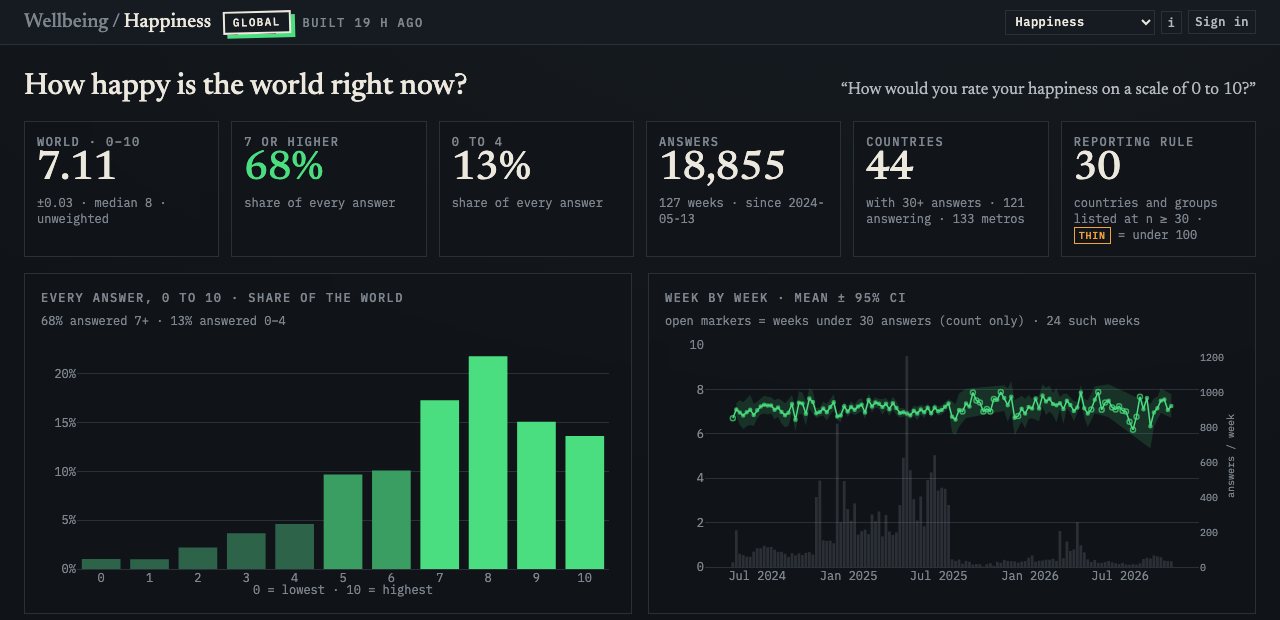
Every week, Mic Check asks people how their lives are going: 18,855 answers from 121 countries and 133 metros since May 2024.
Nielsen, measurement 2011–2021 · what counts as a view, a listen, an exposure
Mic Check, a survey engine 2021 – present · the same questions, answered city by city, weighted by geography
Ward Wise / Penlight 2024 – present · Chicago measured by ward, neighborhood and square mile
To compare cities, I first have to decide what a city is. That question is personal, and it is why this work exists.
Why I care
My own board has to choose a Chicago
city-defined · each city's own ZIP frameUN-defined · plus a sample from the dense ring
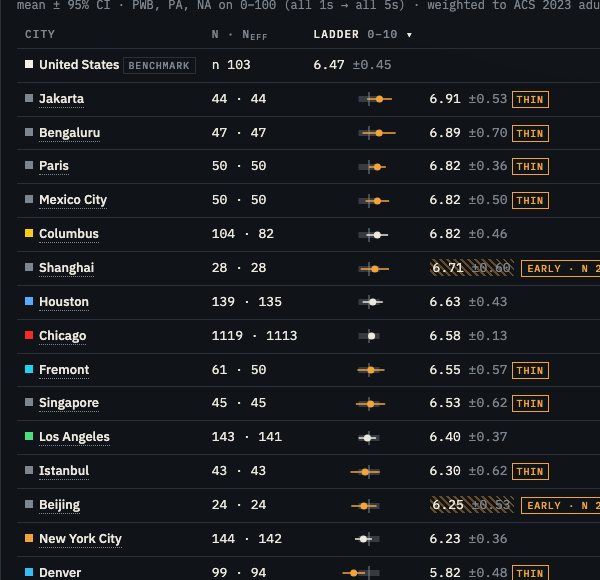
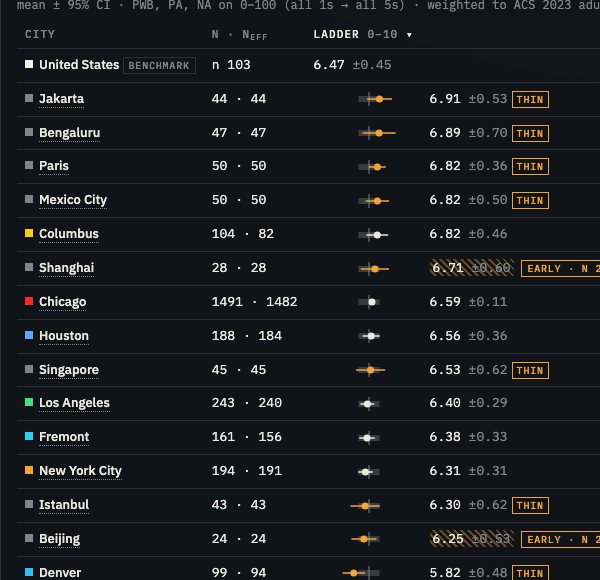
Life evaluation, 0–10
city
UN
Houstonn 139 → 188
#1 · 6.62± 0.43
#2 · 6.56± 0.36
Chicagon 1,119 → 1,491
#2 · 6.58± 0.13
#1 · 6.59± 0.11
Fremontn 61 → 161
#3 · 6.55± 0.57
#4 · 6.38± 0.33
Los Angelesn 143 → 243
#4 · 6.40± 0.37
#3 · 6.40± 0.29
New York Cityn 144 → 194
#5 · 6.23± 0.36
#5 · 6.31± 0.31
Flip one switch and the order changes. The intervals overlap, so neither order is a finding. The finding is that the ranking depends on the boundary, and a reader cannot tell which one they are seeing unless the number says so. This UN-defined view is live today on Mic Check's board; offering it in Ward Wise's Penlight is the next step.
1 · Who draws the lines?
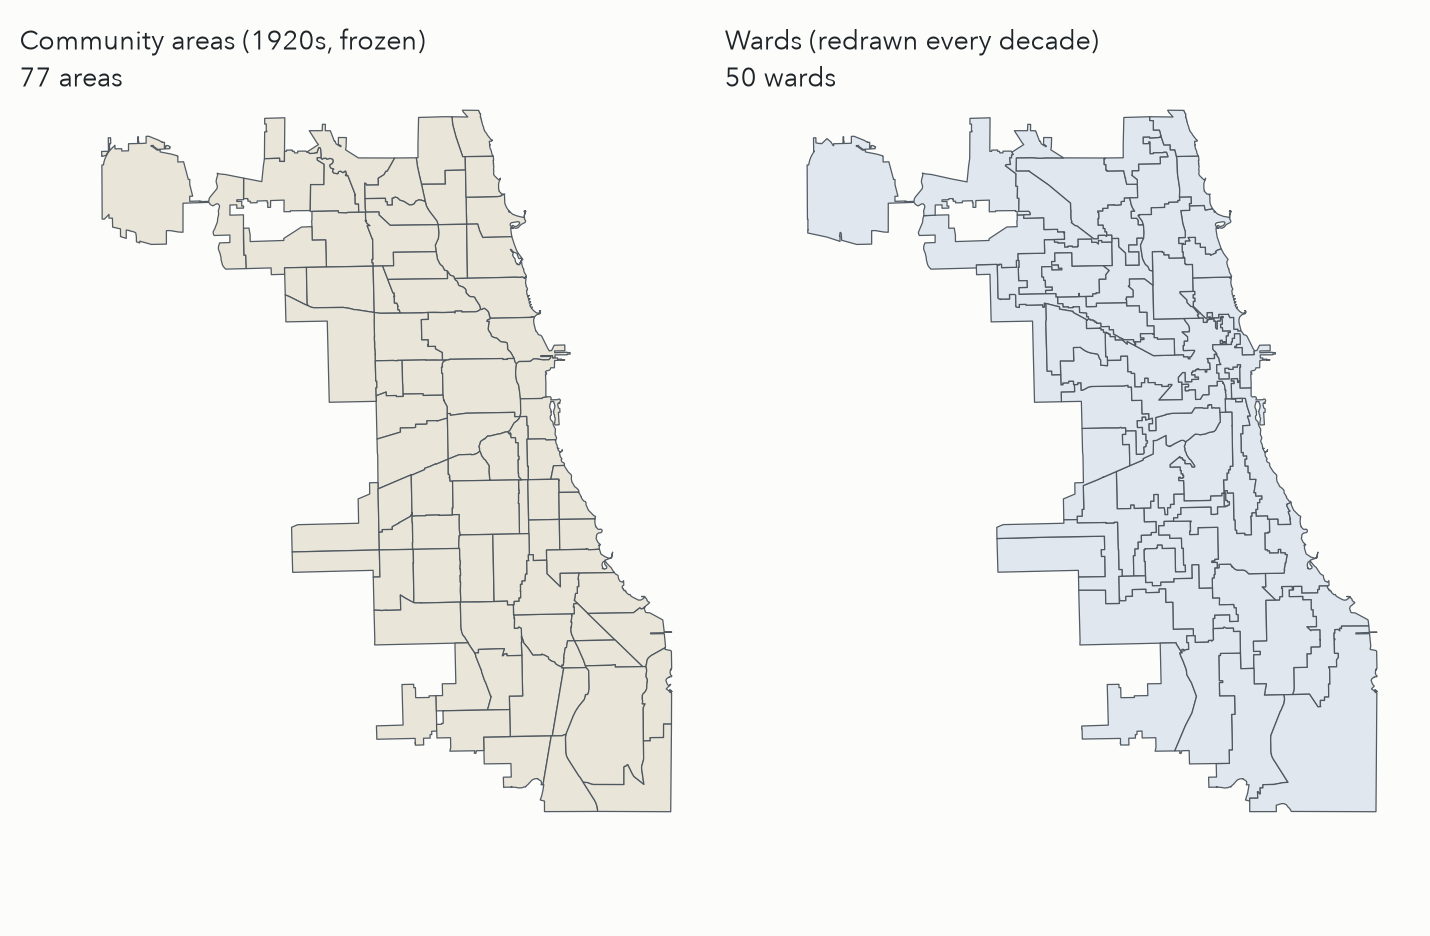
Chicago: 77 frozen areas, 50 moving wards
1920s: the University of Chicago's Social Science Research Committee, led by Ernest Burgess, cut the city into 75 community areas for publishing the 1930 census.
The boundaries were frozen on purpose, so that each decade's numbers could be compared with the last.
1956: O'Hare became area 76 after the airport was annexed.
1980: Edgewater split from Uptown, area 77. No change since.
The 50 wards are redrawn after every census, so a ward number never means the same place twice.
1 · Who draws the lines?
Every official line has an author
City limits are the sum of every annexation ordinance since 1837, each petitioned by landowners or approved by voters.
ZIP codes are mail routes. They exist to move letters, and the Postal Service changes them when the routes change.
Metro areas are lists of whole counties, joined when a quarter of a county's workers commute into the core.
“Nobody can recompute this line. Anyone can download it.”What Is Chicago?, on the city limits
2 · What do the lines cost us?
Five Chicagos, five authors, one decade
Definition
Author
People (2020)
km²
ZIPs
City of Chicago
City Council, by ordinance
2,744,500
599
56
UN urban centre (2025)
UN DESA, from the JRC grid
3,683,951
932
98
Older GHSL rule (2023)
Joint Research Centre
5,533,687
2,231
174
Census urban area
Census Bureau, from blocks
8,669,050
6,148
301
Metro area (CBSA)
OMB, from commuting flows
9,447,373
18,186
362
2020 residents inside each boundary, from the Census PL 94-171 block counts; a ZIP counts when at least half its residents live inside. Source: the explainer's data bundle (built 2026-09-08). Mic Check samples Chicago by ZIP: the city-defined board draws from the first row's 56 ZIPs, and a ring sample over 48 more extends it to the UN centre.
2 · What do the lines cost us?
Comparability: the UN changed its ruler
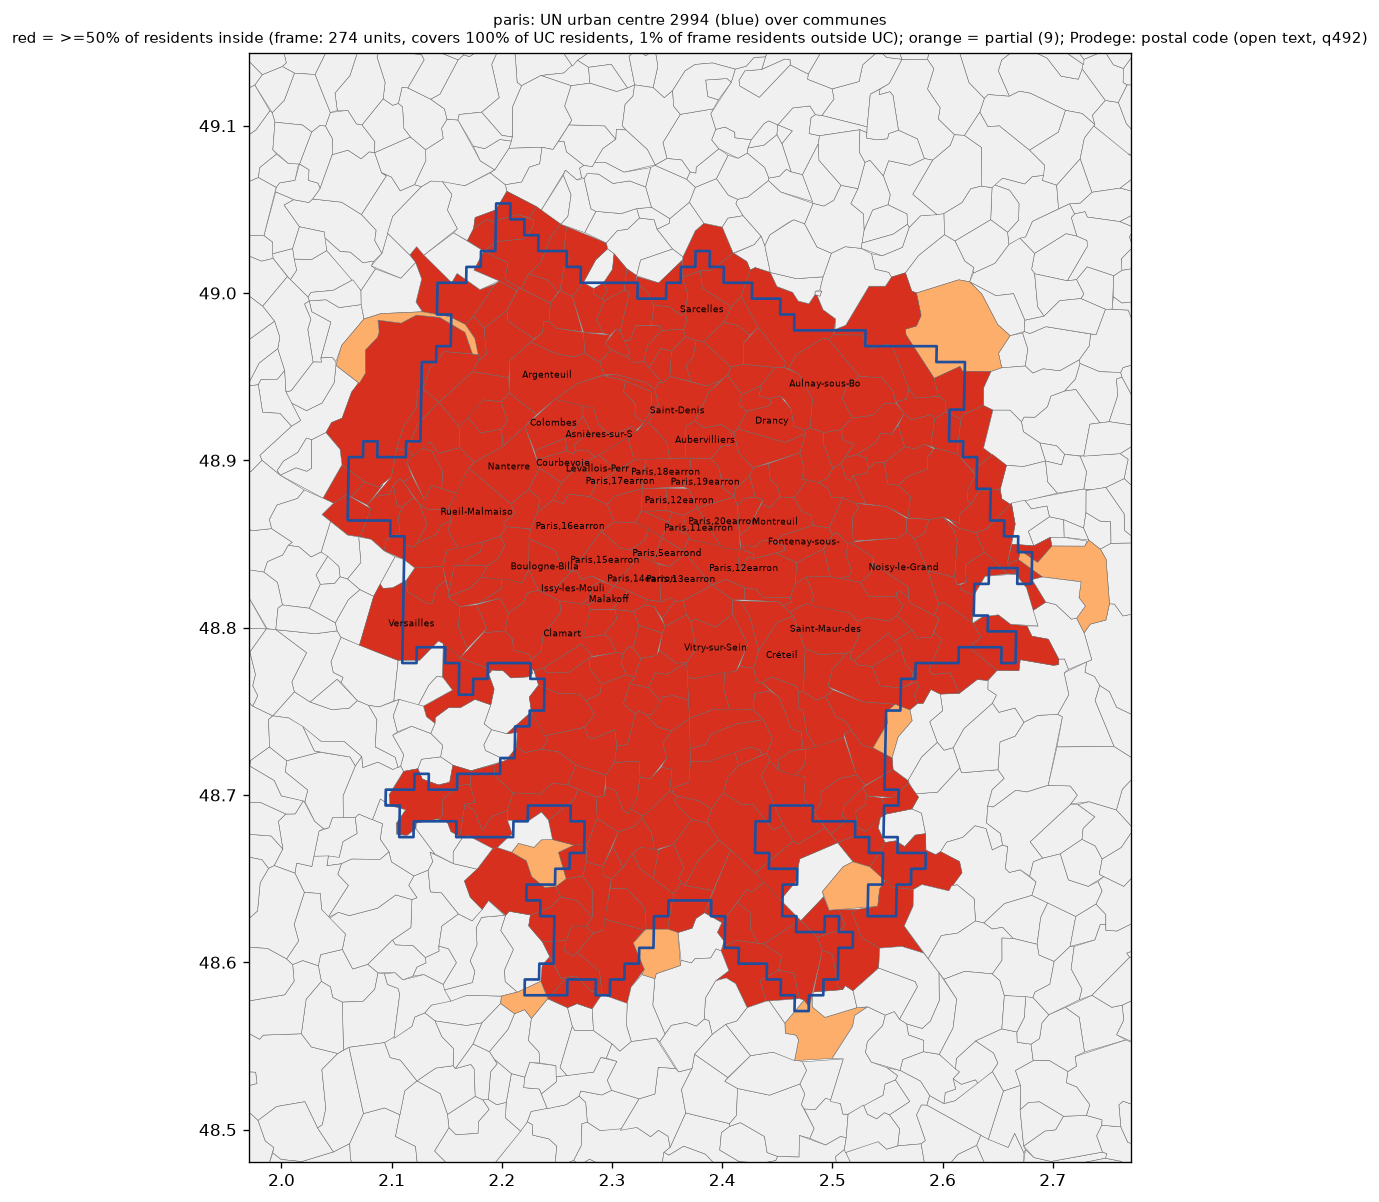
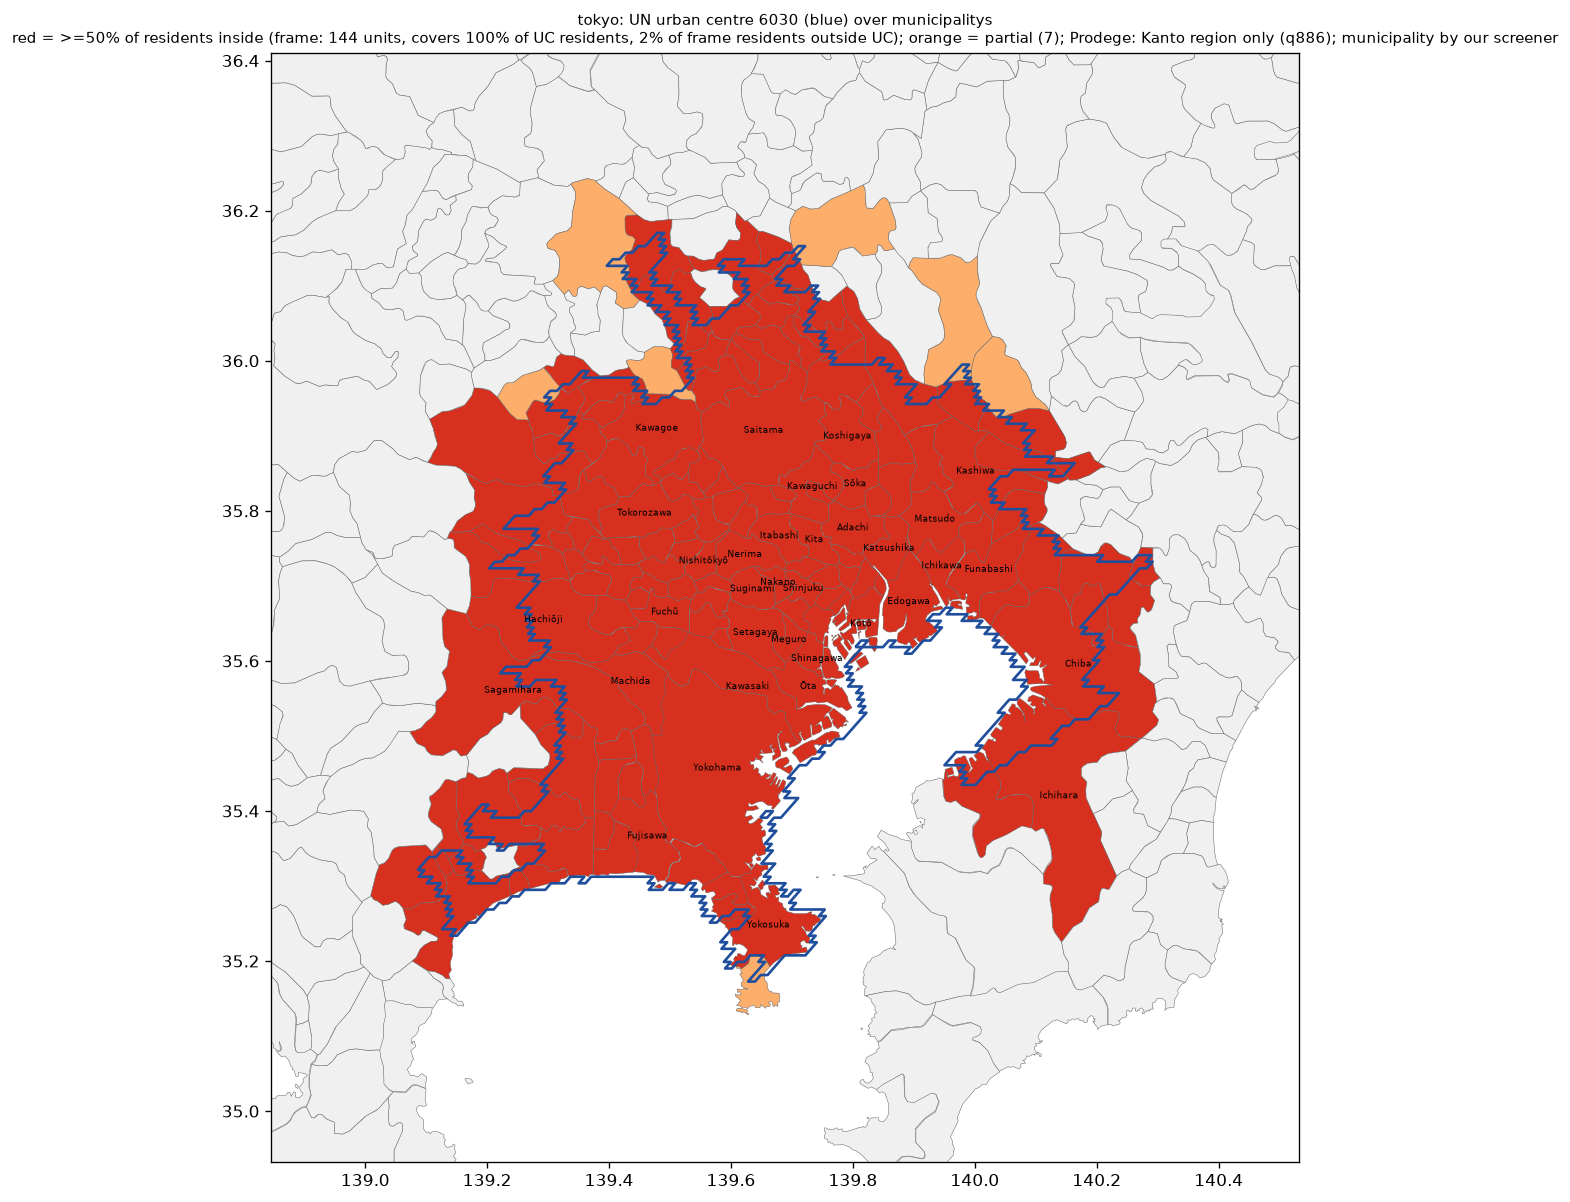
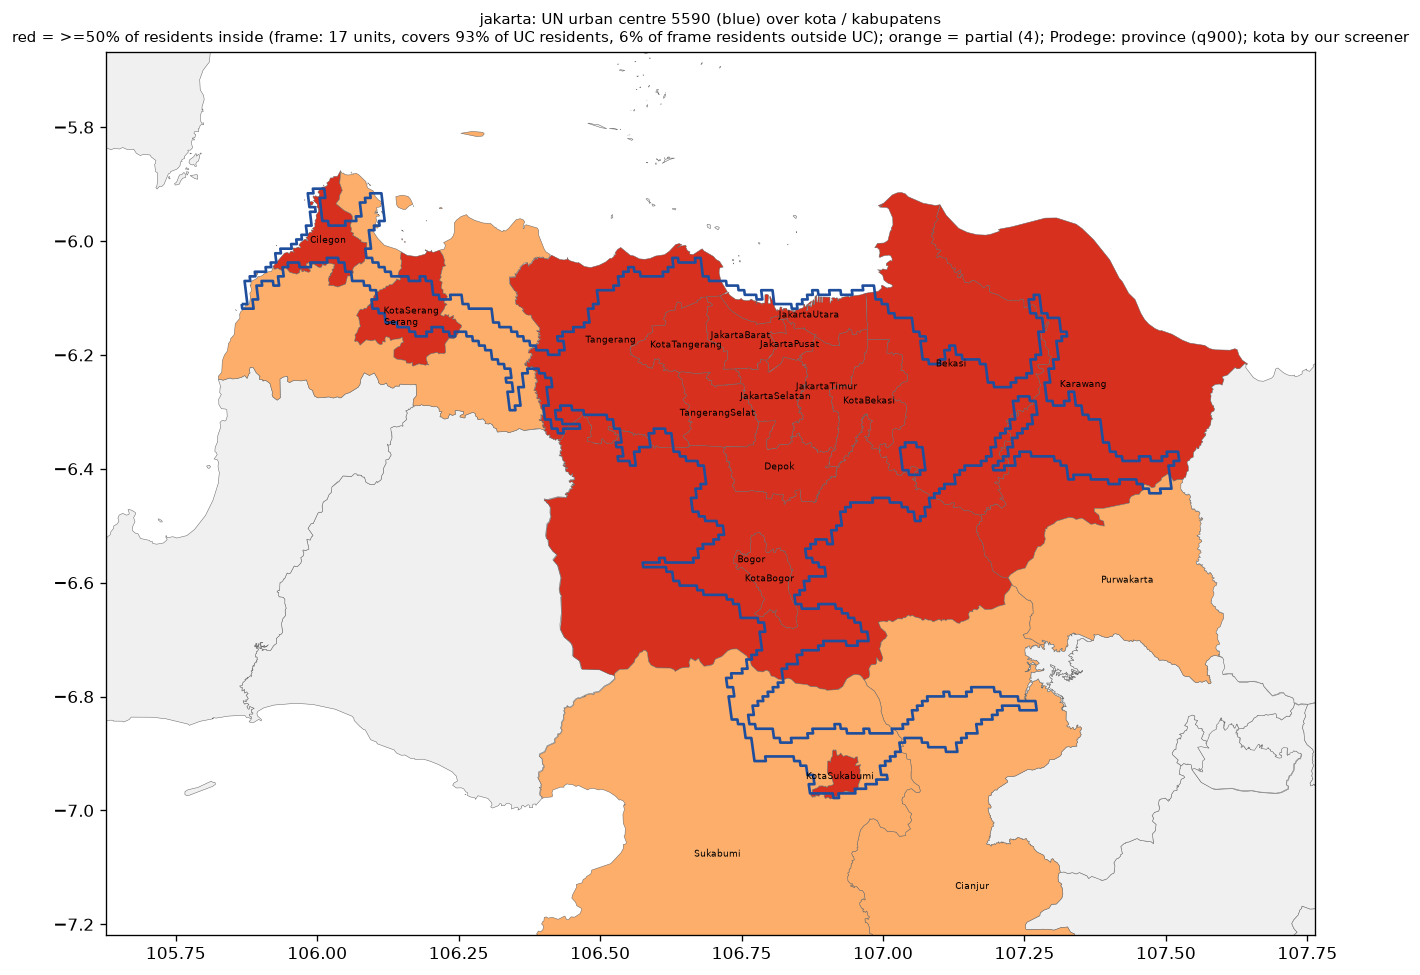
The 2018 edition carried the Census urbanized area forward to about 8.9 million. The 2025 edition applies one rule to the whole planet: Chicago is 3,683,385, ranked 125. Same city, same decade; only the definition moved. The same rule drawn over local units elsewhere:
Paris · communes · 274 units cover 100% of the centre's 9.4M; 1% of their residents sit outside it
Tokyo · municipalities · 144 units cover 100% of the centre's 33.2M; 2% of their residents sit outside it
Jakarta · kota / kabupaten · 17 units cover 93% of the centre's 41.9M; 6% of their residents sit outside it
3 · Is there a rule instead?
Four first principles
Start from a lattice, not from borders. Equal cells over the whole surface; city limits, counties and ZIPs play no part.
One public rule. Thresholds anyone can read: a density, a size, a neighbourhood vote.
Regenerable by anyone. Public data and a published recipe in, the same polygons out, cell for cell.
Versioned. When the rule changes, the old polygons stay citable and the change is one clause you can name.
3 · The UN rule on Chicago · Step one of six
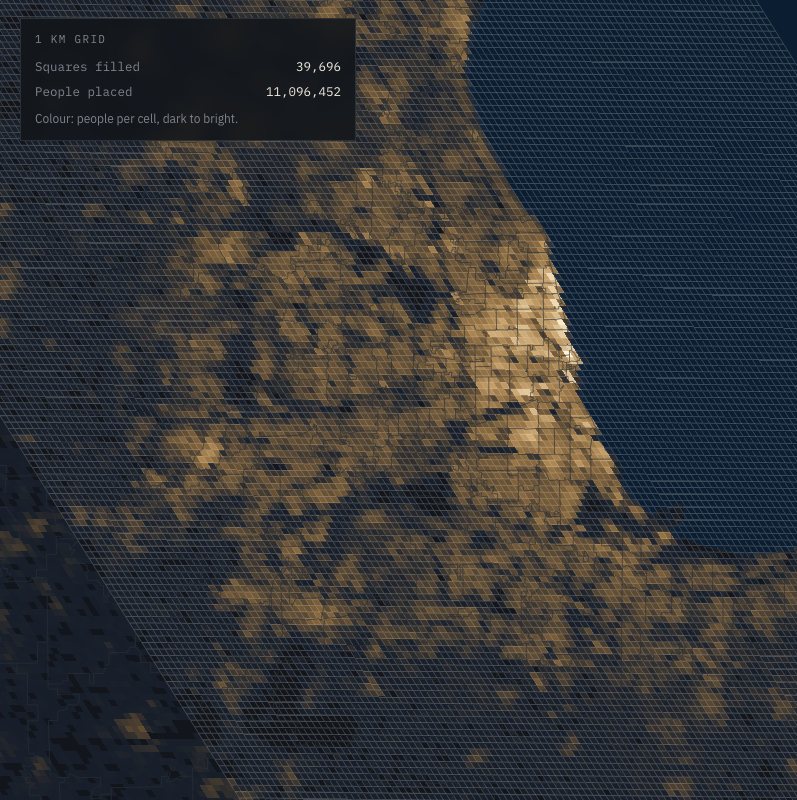
Step one: ignore every border.
The rule starts from a grid of one-kilometre squares laid over the whole planet, with an estimate of how many people live in each square. City limits, county lines and zip codes play no part.
The grid is drawn in an equal-area world projection, which is why it sits at a slight tilt over Chicago. Hover a square to read its population.
Live: miccheck.media/what-is-chicago#beat=grid
3 · The UN rule on Chicago · Step two of six
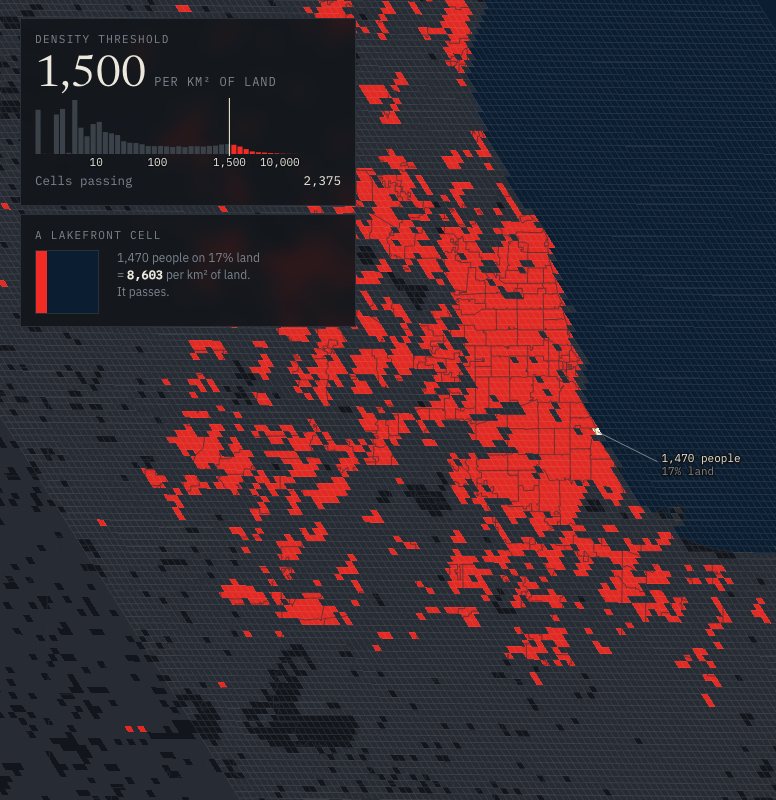
Step two: keep only the dense squares.
A square counts as dense if it holds at least 1,500 people per square kilometre of land. Water does not count toward the area, so a lakefront square with a sliver of shore can pass on a few hundred residents. Everything else goes dark.
Live: miccheck.media/what-is-chicago#beat=dense
3 · The UN rule on Chicago · Step three of six
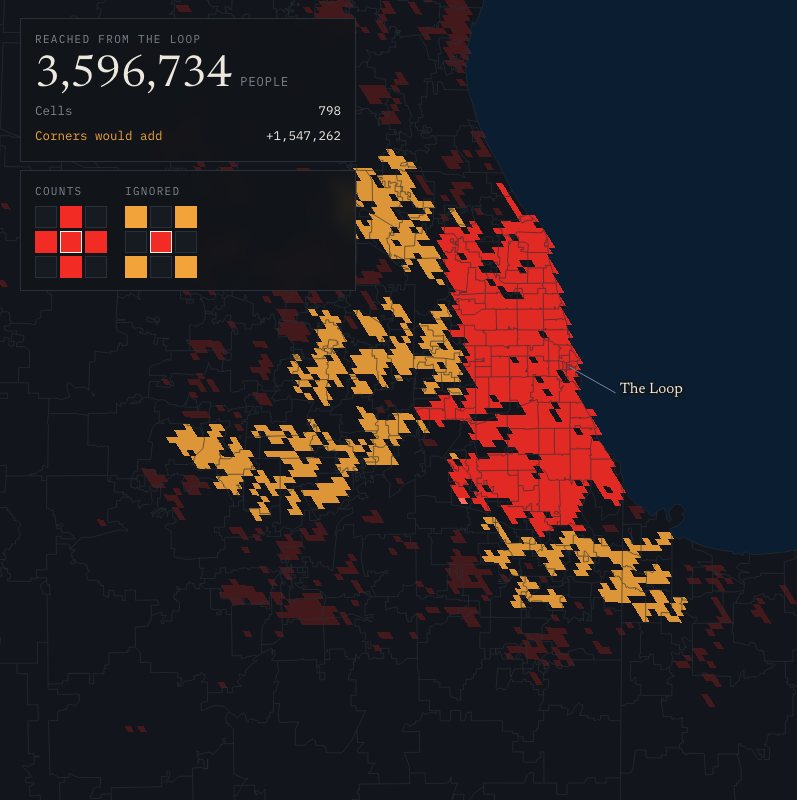
Step three: dense squares must touch side to side.
Dense squares that share an edge belong to the same cluster. Squares that only meet at a corner do not. Watch the connection spread from the Loop and stop wherever the chain breaks.
If corners counted, the Loop's cluster would pick up another 1.5 million people.
Live: miccheck.media/what-is-chicago#beat=connect
3 · The UN rule on Chicago · Step four of six
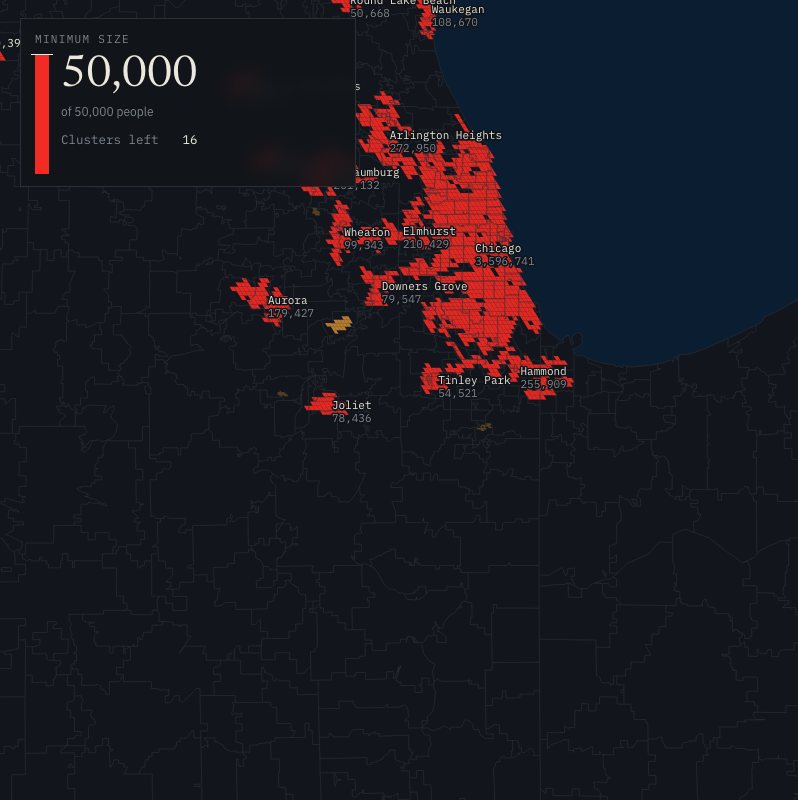
Step four: a cluster needs 50,000 people.
There are 301 dense clusters in the region. Most are a few squares around a town centre. The bar rises to 50,000 and everything under it drops out. 16 clusters survive. They are the seeds of the urban centres.
Live: miccheck.media/what-is-chicago#beat=size
3 · The UN rule on Chicago · Step five of six
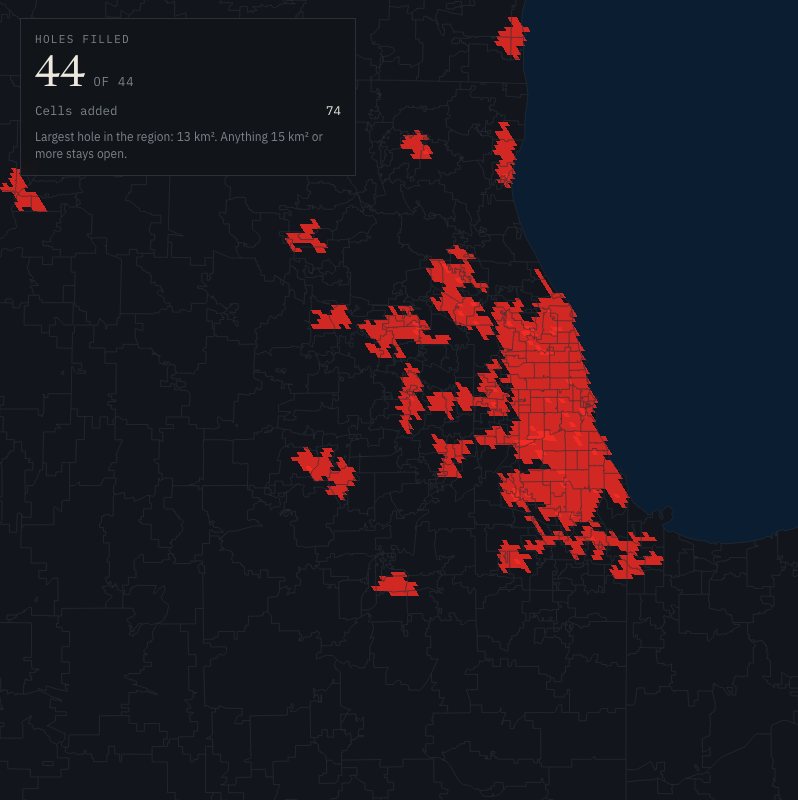
Step five: fill the small holes.
Parks, rail yards, cemeteries and factory land leave gaps inside a cluster. Any enclosed gap smaller than 15 square kilometres is filled in. Nothing larger is.
44 holes in the region, 74 squares in all.
Live: miccheck.media/what-is-chicago#beat=holes
3 · The UN rule on Chicago · Step six of six
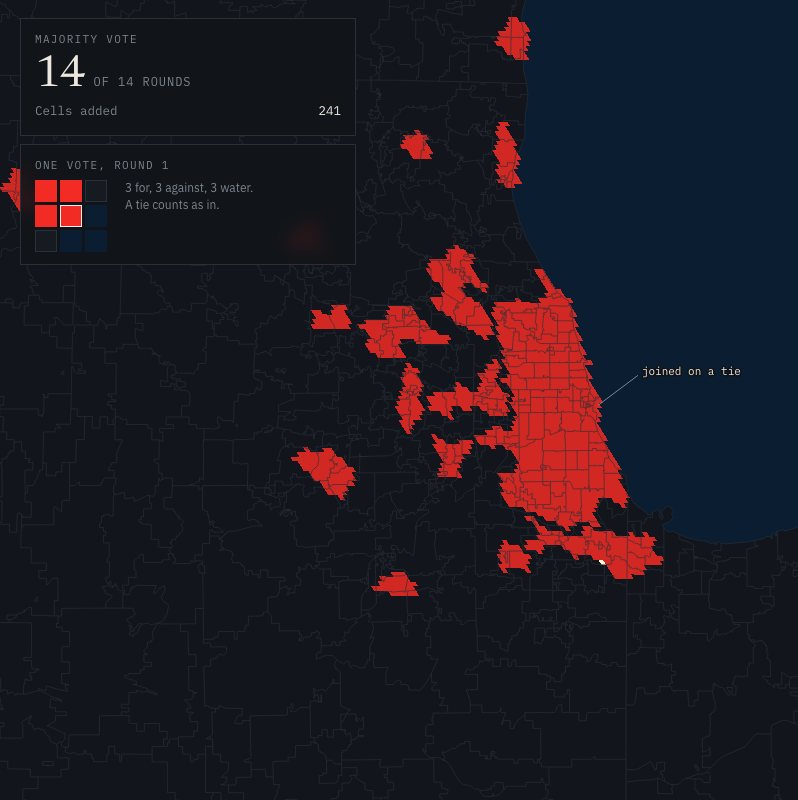
Step six: smooth the edges by majority vote.
Each square just outside a centre looks at its 3-by-3 neighbourhood. Water squares abstain. If at least half of the voters are inside, the square joins. The vote repeats until nothing changes: 14 rounds for the Chicago region.
Live: miccheck.media/what-is-chicago#beat=smooth
3 · The UN rule on Chicago
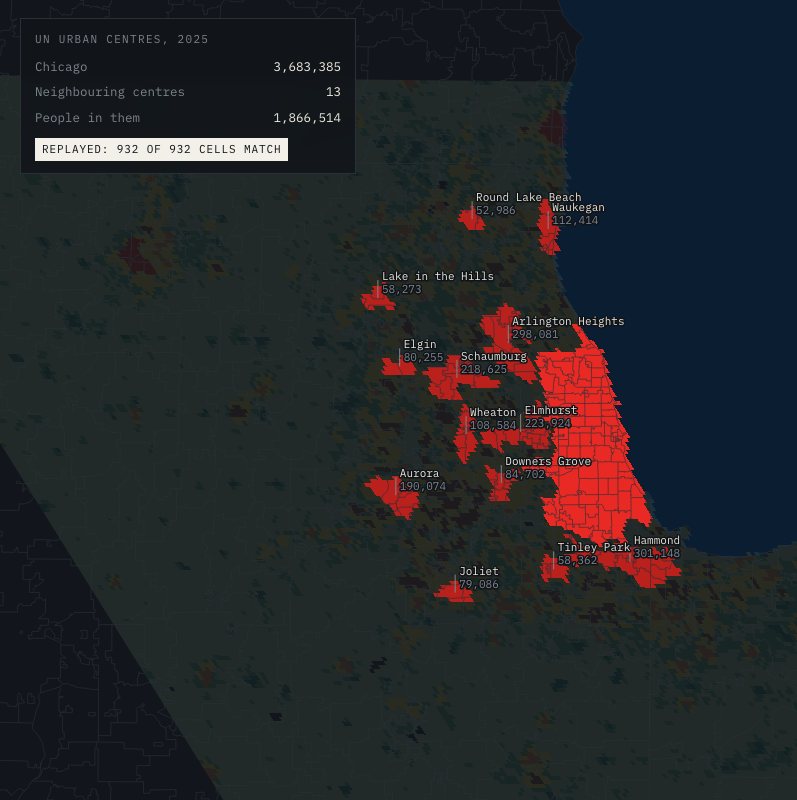
The result: 932 km², 3,683,385 people
Every break in the chain of dense squares became a border. Replaying the rule on the public grid reproduces the UN's boundary exactly: 932 of 932 cells match. The neighbours, each its own city to the UN:
Hammond301,148
Arlington Heights298,081
Elmhurst223,924
Schaumburg218,625
Aurora190,074
Waukegan112,414
Wheaton108,584
Downers Grove84,702
Elgin80,255
Joliet79,086
Tinley Park58,362
Lake in the Hills58,273
Round Lake Beach52,986
13 neighbouring centres, 1,866,514 people between them. 2025 grid populations.
4 · Peoria
To the UN, Peoria is a town
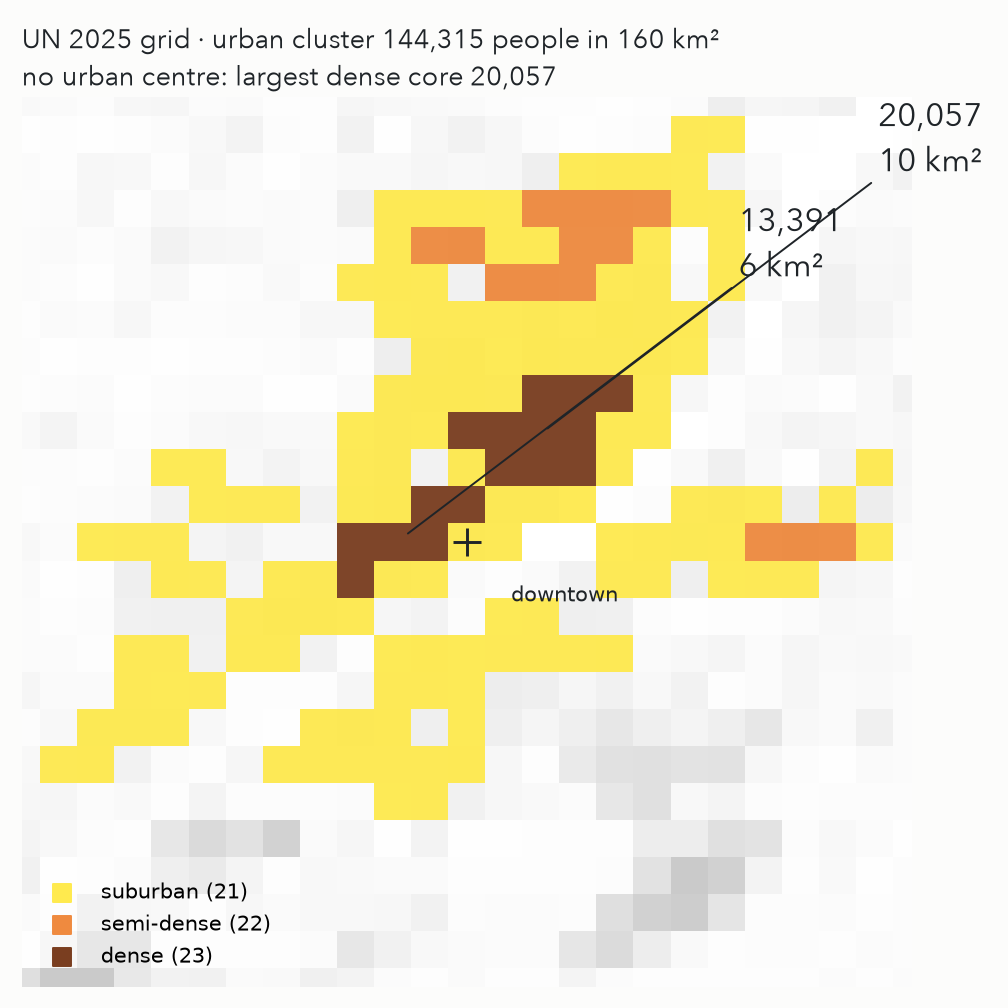
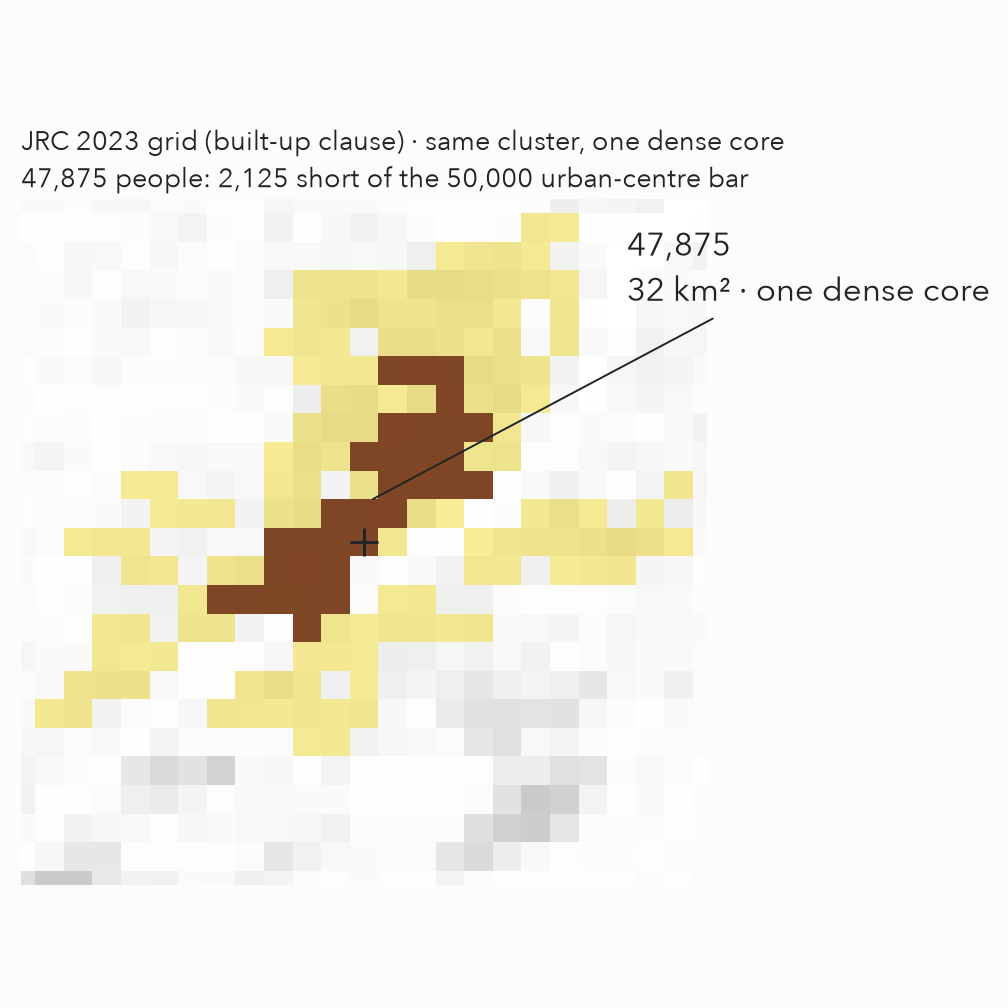
144,315people in Peoria's urban cluster on the 2025 grid (160 km²); 144,549 on the 2023 grid
47,875in its one dense core under the 2023 rule: 2,125 short of the 50,000 an urban centre needs
20,057 + 13,391the same core under the 2025 rule, split in two with the built-up clause gone. No urban centre; the UN's city table skips Peoria
4 · Illinois
Illinois under the rule: cities and towns
City
UN 2025 urban centre
JRC 2023 urban centre
City limits 2020
Metro area 2020
Peoria
nonelargest dense core 20,057
nonelargest dense core 47,875
113,150124 km²
368,789Peoria, IL
Springfield
nonelargest dense core 13,878
nonelargest dense core 44,311
114,394158 km²
208,636Springfield, IL
Rockford
86,647
150,998
148,655167 km²
338,788Rockford, IL
Champaign
79,407
87,759
88,30259 km²
236,075Champaign-Urbana, IL
Bloomington
58,461
78,345
78,68070 km²
170,956Bloomington, IL
Urban centres: contiguous 1 km cells of class 30 on each published grid, replayed from the rasters (tools/peoria_stills.py). City limits: Census 2020 PL 94-171 geoheader, summary level 160, Illinois. Metro: U.S. Census Bureau, Population Estimates Program, Vintage 2023 CBSA table, April 1 2020 estimates base, 2023 OMB delineations.
4 · Comparables
Peoria's peers: three honest lists that do not agree
By city-proper populationPeoria city, Illinois · 113,174
Broken Arrow, Oklahoma113,553
Lansing, Michigan112,661
Lakeland, Florida112,629
High Point, North Carolina114,161
Gresham, Oregon114,249
By metro areaPeoria, IL · 368,789
Atlantic City-Hammonton, NJ369,798
Ann Arbor, MI372,258
Hickory-Lenoir-Morganton, NC365,270
Naples-Marco Island, FL375,760
Ocala, FL375,904
By UN settlement, USPeoria, Illinois · 144,315 · tier: town
Deltona, Florida156,006
Tuscaloosa, Alabama125,962
Harlingen, Texas119,381
Winter Haven, Florida146,841
Waco, Texas166,057
Across all 97 Illinois settlements, the city-limits and metro lists share 12 names with the settlement list. Every settlement's lists: miccheck.media/parallel-peorias.
4 · One clause
One clause, and fourteen centres become one
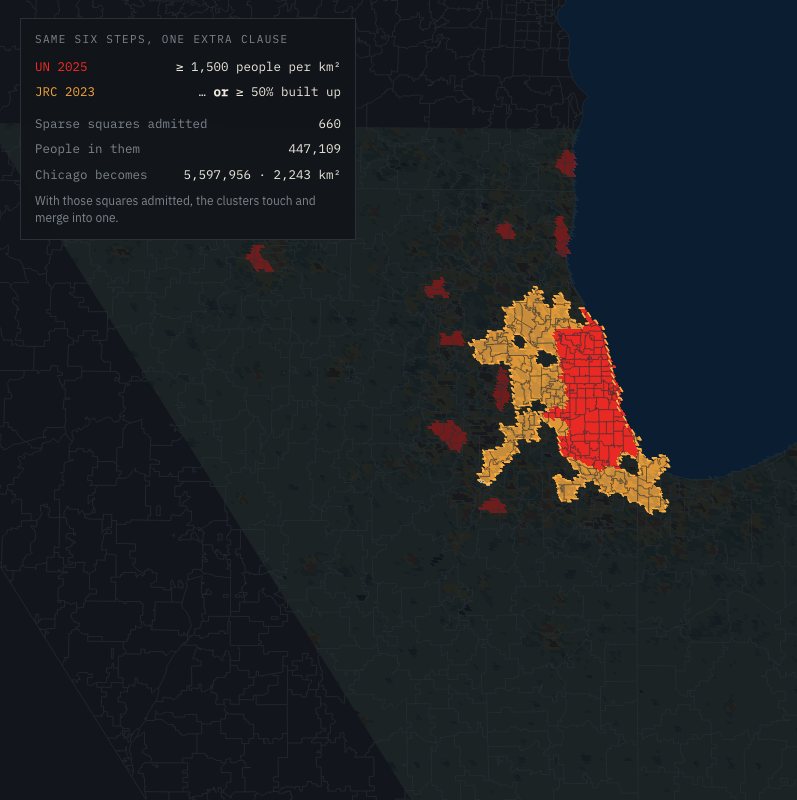
The grid is built by the European Commission's Joint Research Centre, and its own 2023 release used the same six steps with one extra clause: a square also counts as urban if at least half of its land is built up, even when few people live there. That clause admits airports, rail yards, factories, malls and freight terminals, and those squares sit exactly in the gaps between Chicago and its neighbours.
Chicago's peers under one rule, 2025 urban centres (UN MTUC table)
Centre
People
km²
Chicago
3.68M
932
Barcelona
3.98M
454
Berlin
3.56M
686
Sydney
4.15M
1,317
Melbourne
3.64M
1,357
Athína (Athens)
3.10M
404
Busan
3.26M
361
Washington, D.C.
3.27M
1,186
San Francisco
3.16M
915
Houston
3.96M
1,583
5 · Neighborhood scale
The gap: there is no rule below the city
The UN rule stops at the urban centre. Inside it, everything is still somebody's record: 77 areas from the 1920s, 50 wards from the last map, ZIPs from the mail.
None of them is uniform, none is regenerable, and only one is versioned, by accident, when it is redrawn.
What would the four principles give you one mile down?
5 · χGRID
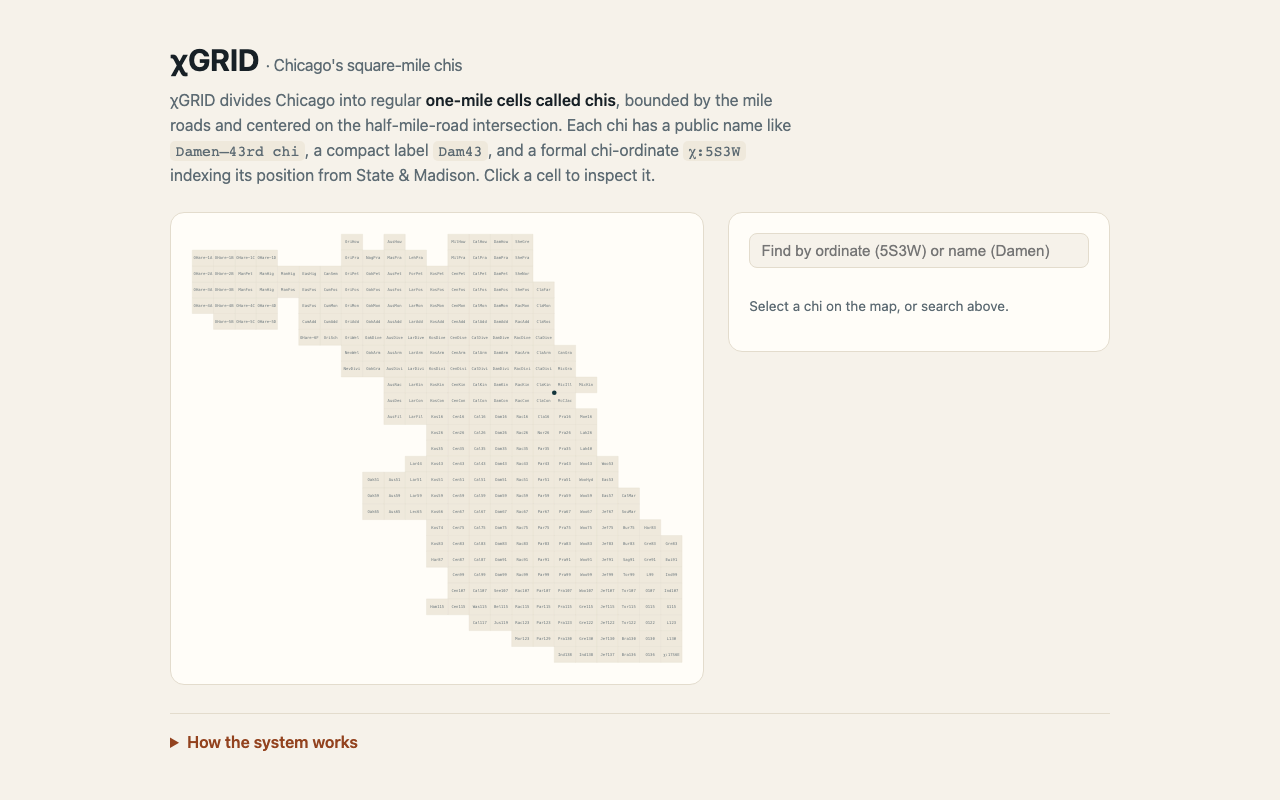
χGRID: a square-mile geography for Chicago
Chicago Geographically Reductive Indexed Districts: the city tiled into roughly one-mile cells, "chis", anchored to the address-grid origin at State & Madison.
Limits are mile roads. Midpoints are the half-mile roads, on both axes.
A layer beneath neighborhoods and community areas, not a replacement: where a neighborhood name is fuzzy, a chi is exact, uniform and addressable.
On GitHub, MIT. Street-aligned cells follow street centerlines: Chicago publishes them; OpenStreetMap has them everywhere.
χ:5S3W = Damen–43rd chi = "Dam43"
5 · χGRID
Naming: three forms, four rules
Ordinate
χ:5S3W
5th mile-band south, 3rd west of State & Madison: formal, sortable
Name
Damen–43rd chi
the avenue first, then the street: human-readable
Label
Dam43
compact, for maps and tables
Number first, 1-indexed. The four cells at the origin are 1S1W, 1S1E, 1N1W, 1N1E; no "0" band, so an index never reads as a false zero distance.
Avenue before street. The north–south road names first.
Half-mile roads are centers, never limits. Damen and 43rd name the cell; Ashland, Western, Pershing and 47th bound it.
v2 carries two names. A local one from the real arterials (Mus99, Muskegon–99th, in the Calumet pocket) and a canonical one from the idealized grid (Bur99, Burnham–99th; RivCon for the origin cell where the river crosses Congress).
5 · χGRID
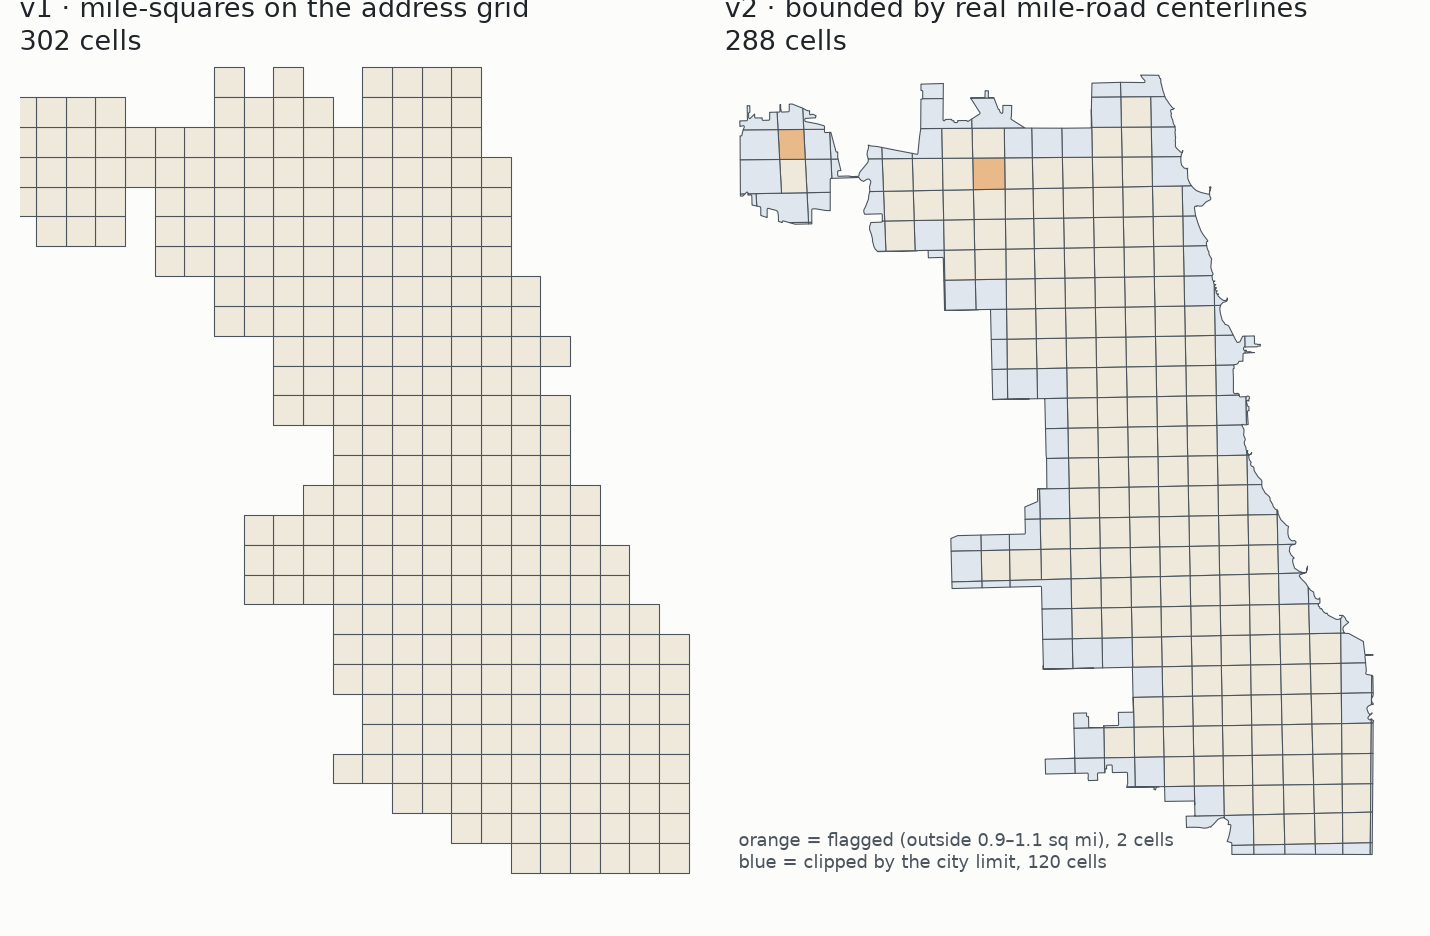
v1 vs v2: 302 ideal squares or 288 real sets of blocks
v1: perfect one-mile squares on the address grid. Every cell is exactly one square mile.
v2: cells bounded by the real mile-road centerlines, clipped to the city limit.
Built by rule: substitute the nearest aligned road where a mile road is missing; impute a straight line where no road exists; flag interior cells outside 0.9–1.1 sq mi; mark edge cells clipped by the limit.
The same trade-off as 2025 vs 2023: a cleaner rule or a truer map, and the version tells you which you chose.
5 · χGRID
In use, and how to do it where you are
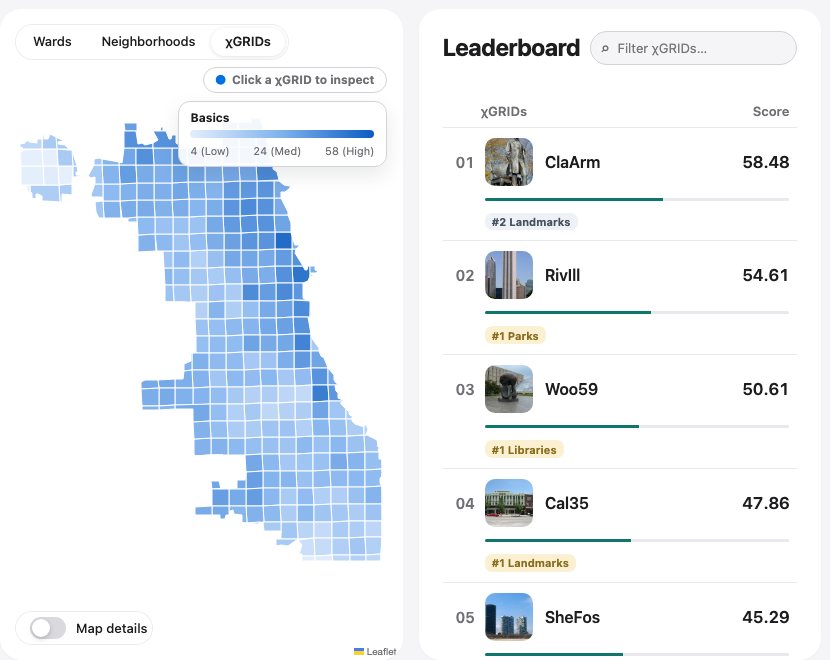
Penlight rolls every measure to wards, neighborhoods and chis: 605,283 chi-level observations in the current civic-data snapshot.
byop/v1, bring your own polygons: a measure repo publishes points, a raster or polygon values with an aggregation spec, and the pipeline rolls it up. Four measures so far (sunscore, parkability, rentrate, microhappiness).
Your city: today's generators are Chicago's (v1 hard-codes State & Madison, v2 its mile roads). The recipe needs three inputs: an address-grid origin, a mile spacing, and your mile roads from OpenStreetMap or your own centerlines.
When a 1 km lattice beats a mile grid: comparing across cities or countries, use the UN's global lattice. Talking to the people who live there, use the grid they already navigate by.
Five answers
Conclusions
Every boundary has an author.Who draws the lines?
A number must say which geography it is about.What do the lines cost us?
A rule beats a record when you need to compare.Is there a rule instead?
To the UN, Peoria is a town, and a rule away from being a city.What does the rule say about Illinois?
A square mile is a neighborhood anyone can regenerate.Can a rule work at neighborhood scale?
Thank you
Links, slides, and a question for you
miccheck.media/ilgisathe slides, the six-step recipe for ArcGIS and QGIS, and a two-question form
 miccheck.media/what-is-chicago
 github.com/HarryBrisson/chiGRIDs
 miccheck.media/ilgisa